Native multimodal agent modelsBuilt for work with lower token consumption

SenseNova native multimodal agent models handle data analysis, deep research, complex image understanding, PPT generation, and more. Token Plan is here—faster, better, more efficient.

01

Native multimodal agents

Native vision for agents—your agent sees the same world you do.

02

Built for enterprise workflows

Long, multi-step office work—analytics, PPT, research, infographics—without breaking a sweat.

03

~60% lower token usage

Versus text-only agents, up to ~60% token savings in search-heavy scenarios.
01 / Model highlights

Lightweight to run, strong on outcomes

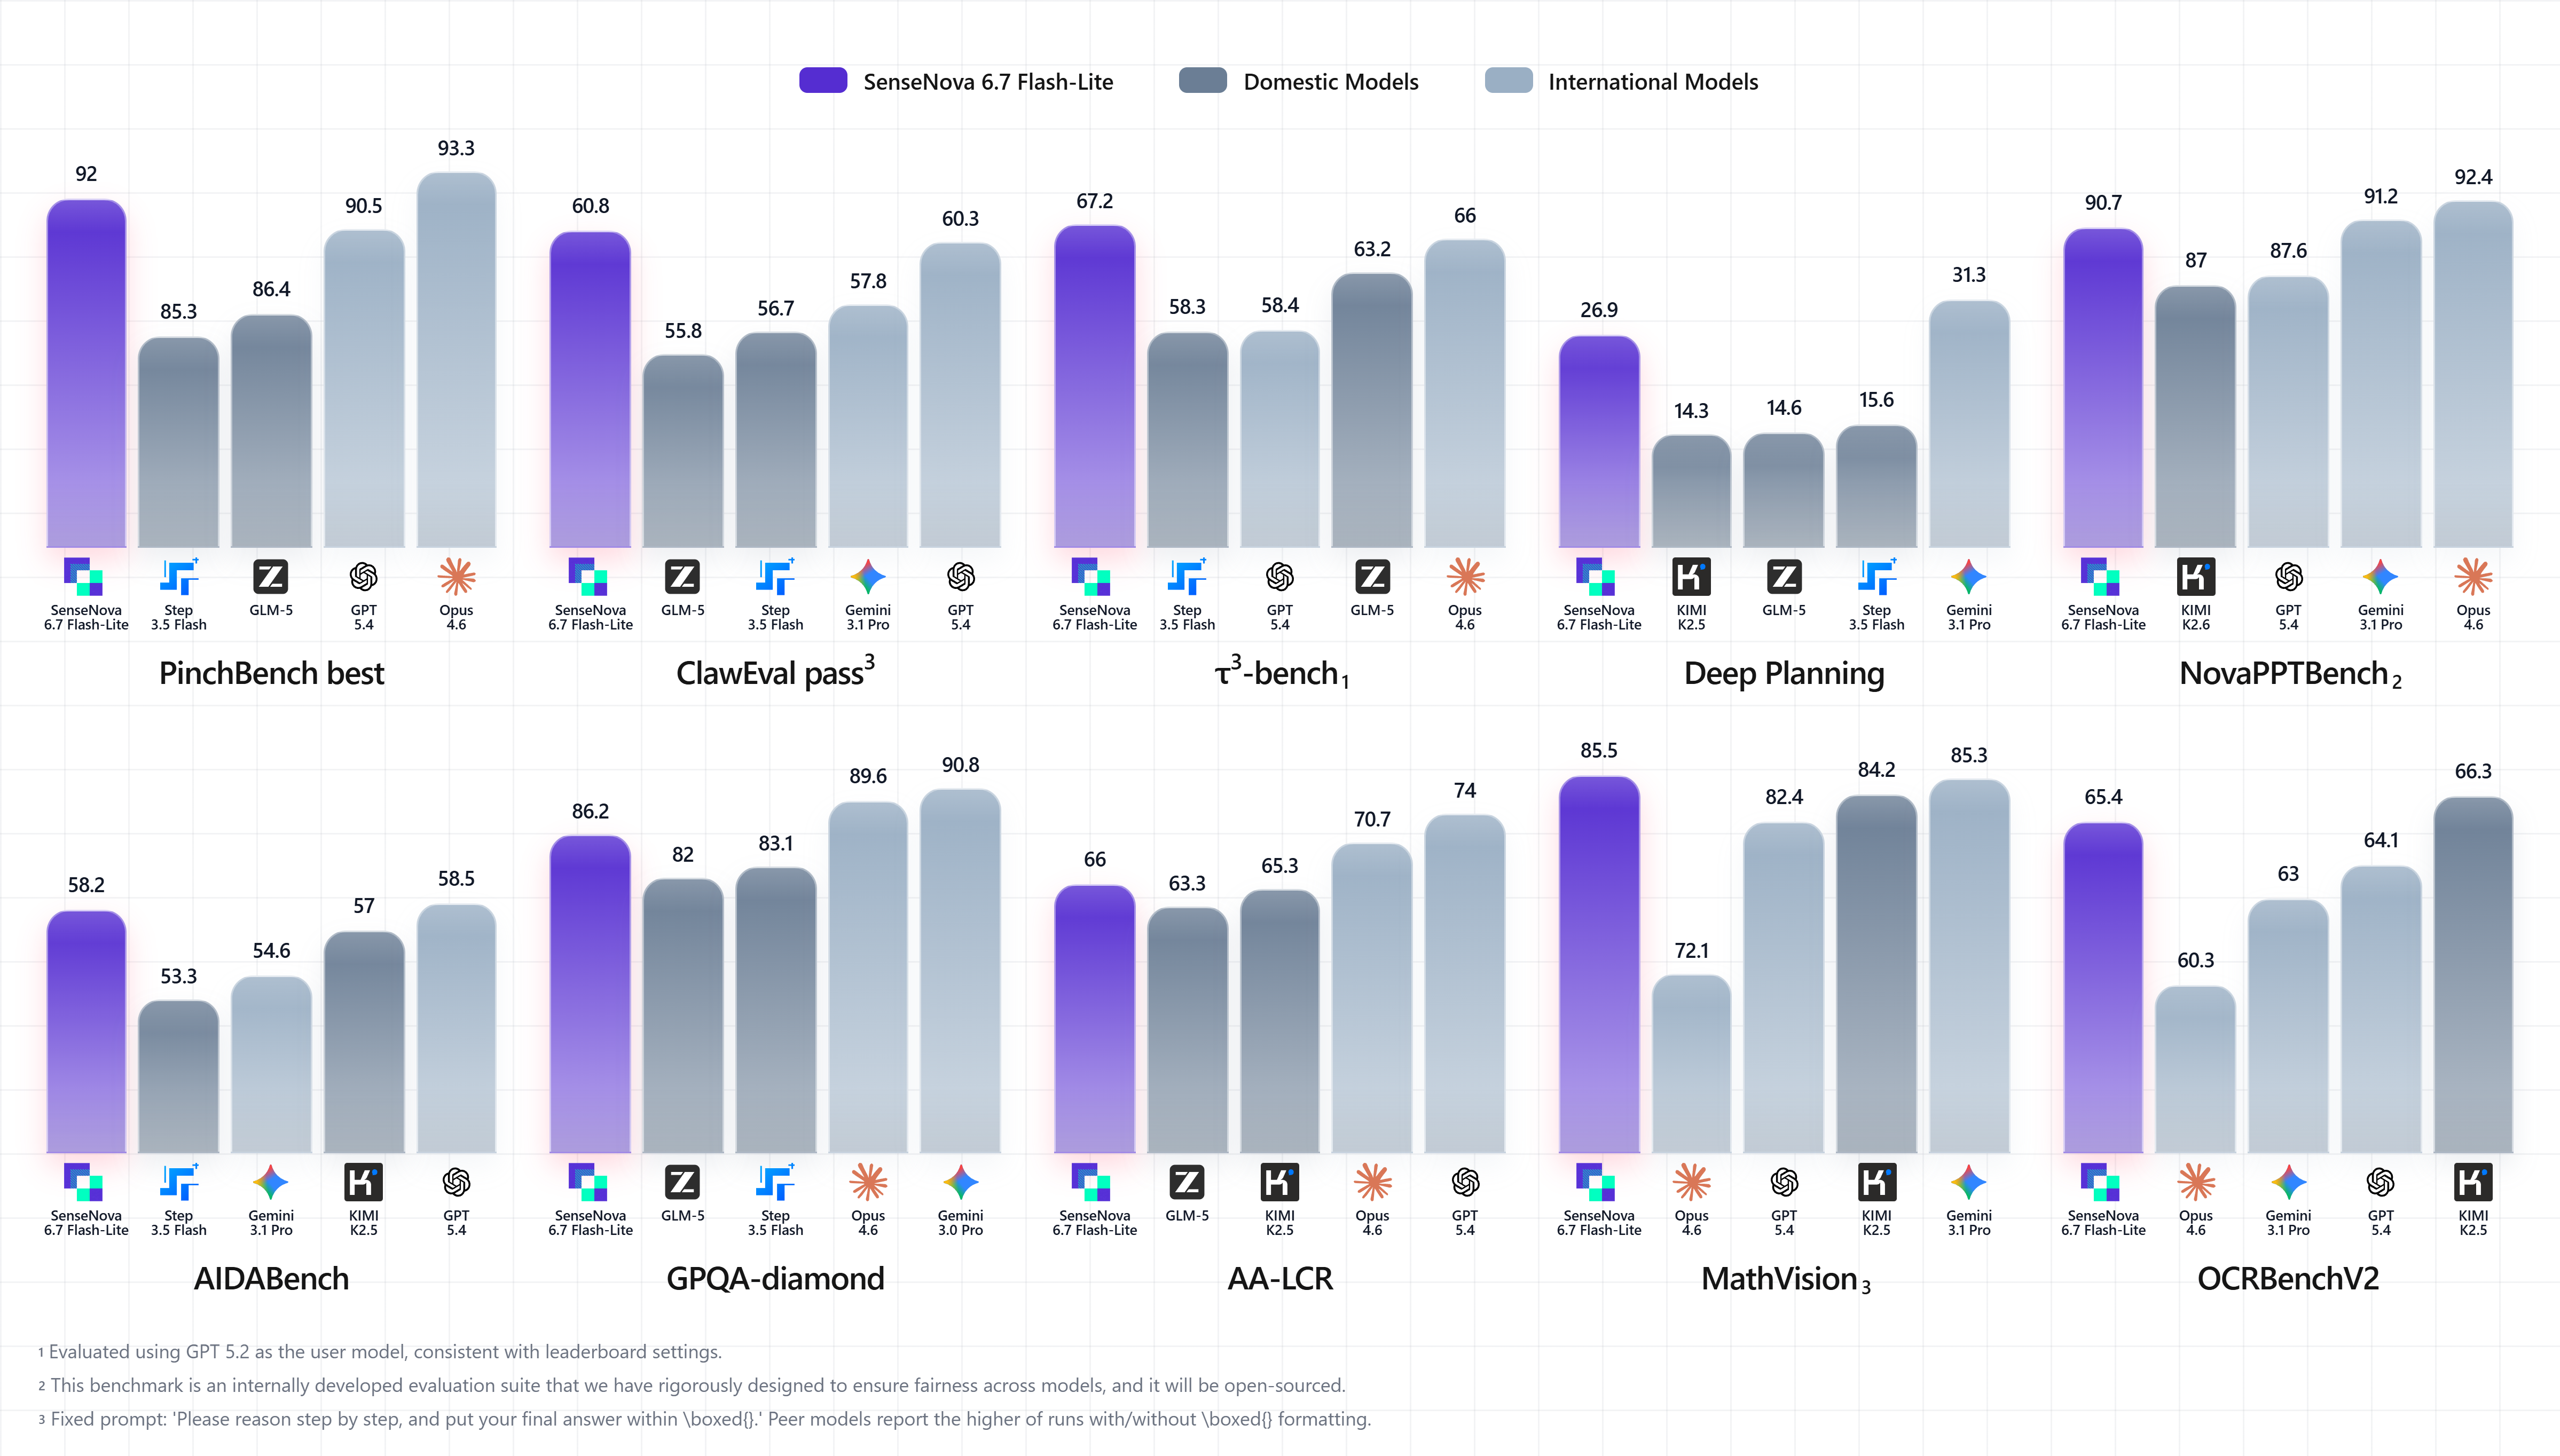
SenseNova 6.7 Flash-Lite is a lightweight multimodal agent model for real workflows; SenseNova U1 Fast unifies multimodal understanding and generation.

Lightweight · Agent-optimized

SenseNova 6.7 Flash-Lite

Lightweight multimodal agent model for real workflows
  • Efficient at scale—quality, cost, and deployability
  • Office-tuned for stable long-chain tasks
  • Native multimodal stack for real-world content
  • Better token efficiency—predictable cost on complex jobs
Multimodal · Understand & generate

SenseNova U1 Fast

Multimodal understanding and generation in one model
  • Accelerated from SenseNova U1, tuned for infographic generation
  • Strong generation with high-density information design
  • Rich layout—infographics and pixel-polished slides

SenseNova 6.7 Flash-Lite · Leading on 10 benchmarks

At similar scale, strong on long chains, planning, and multimodal understanding.

SenseNova 6.7 Flash-Lite benchmark comparison
02 / Use cases

Real office work, end to end

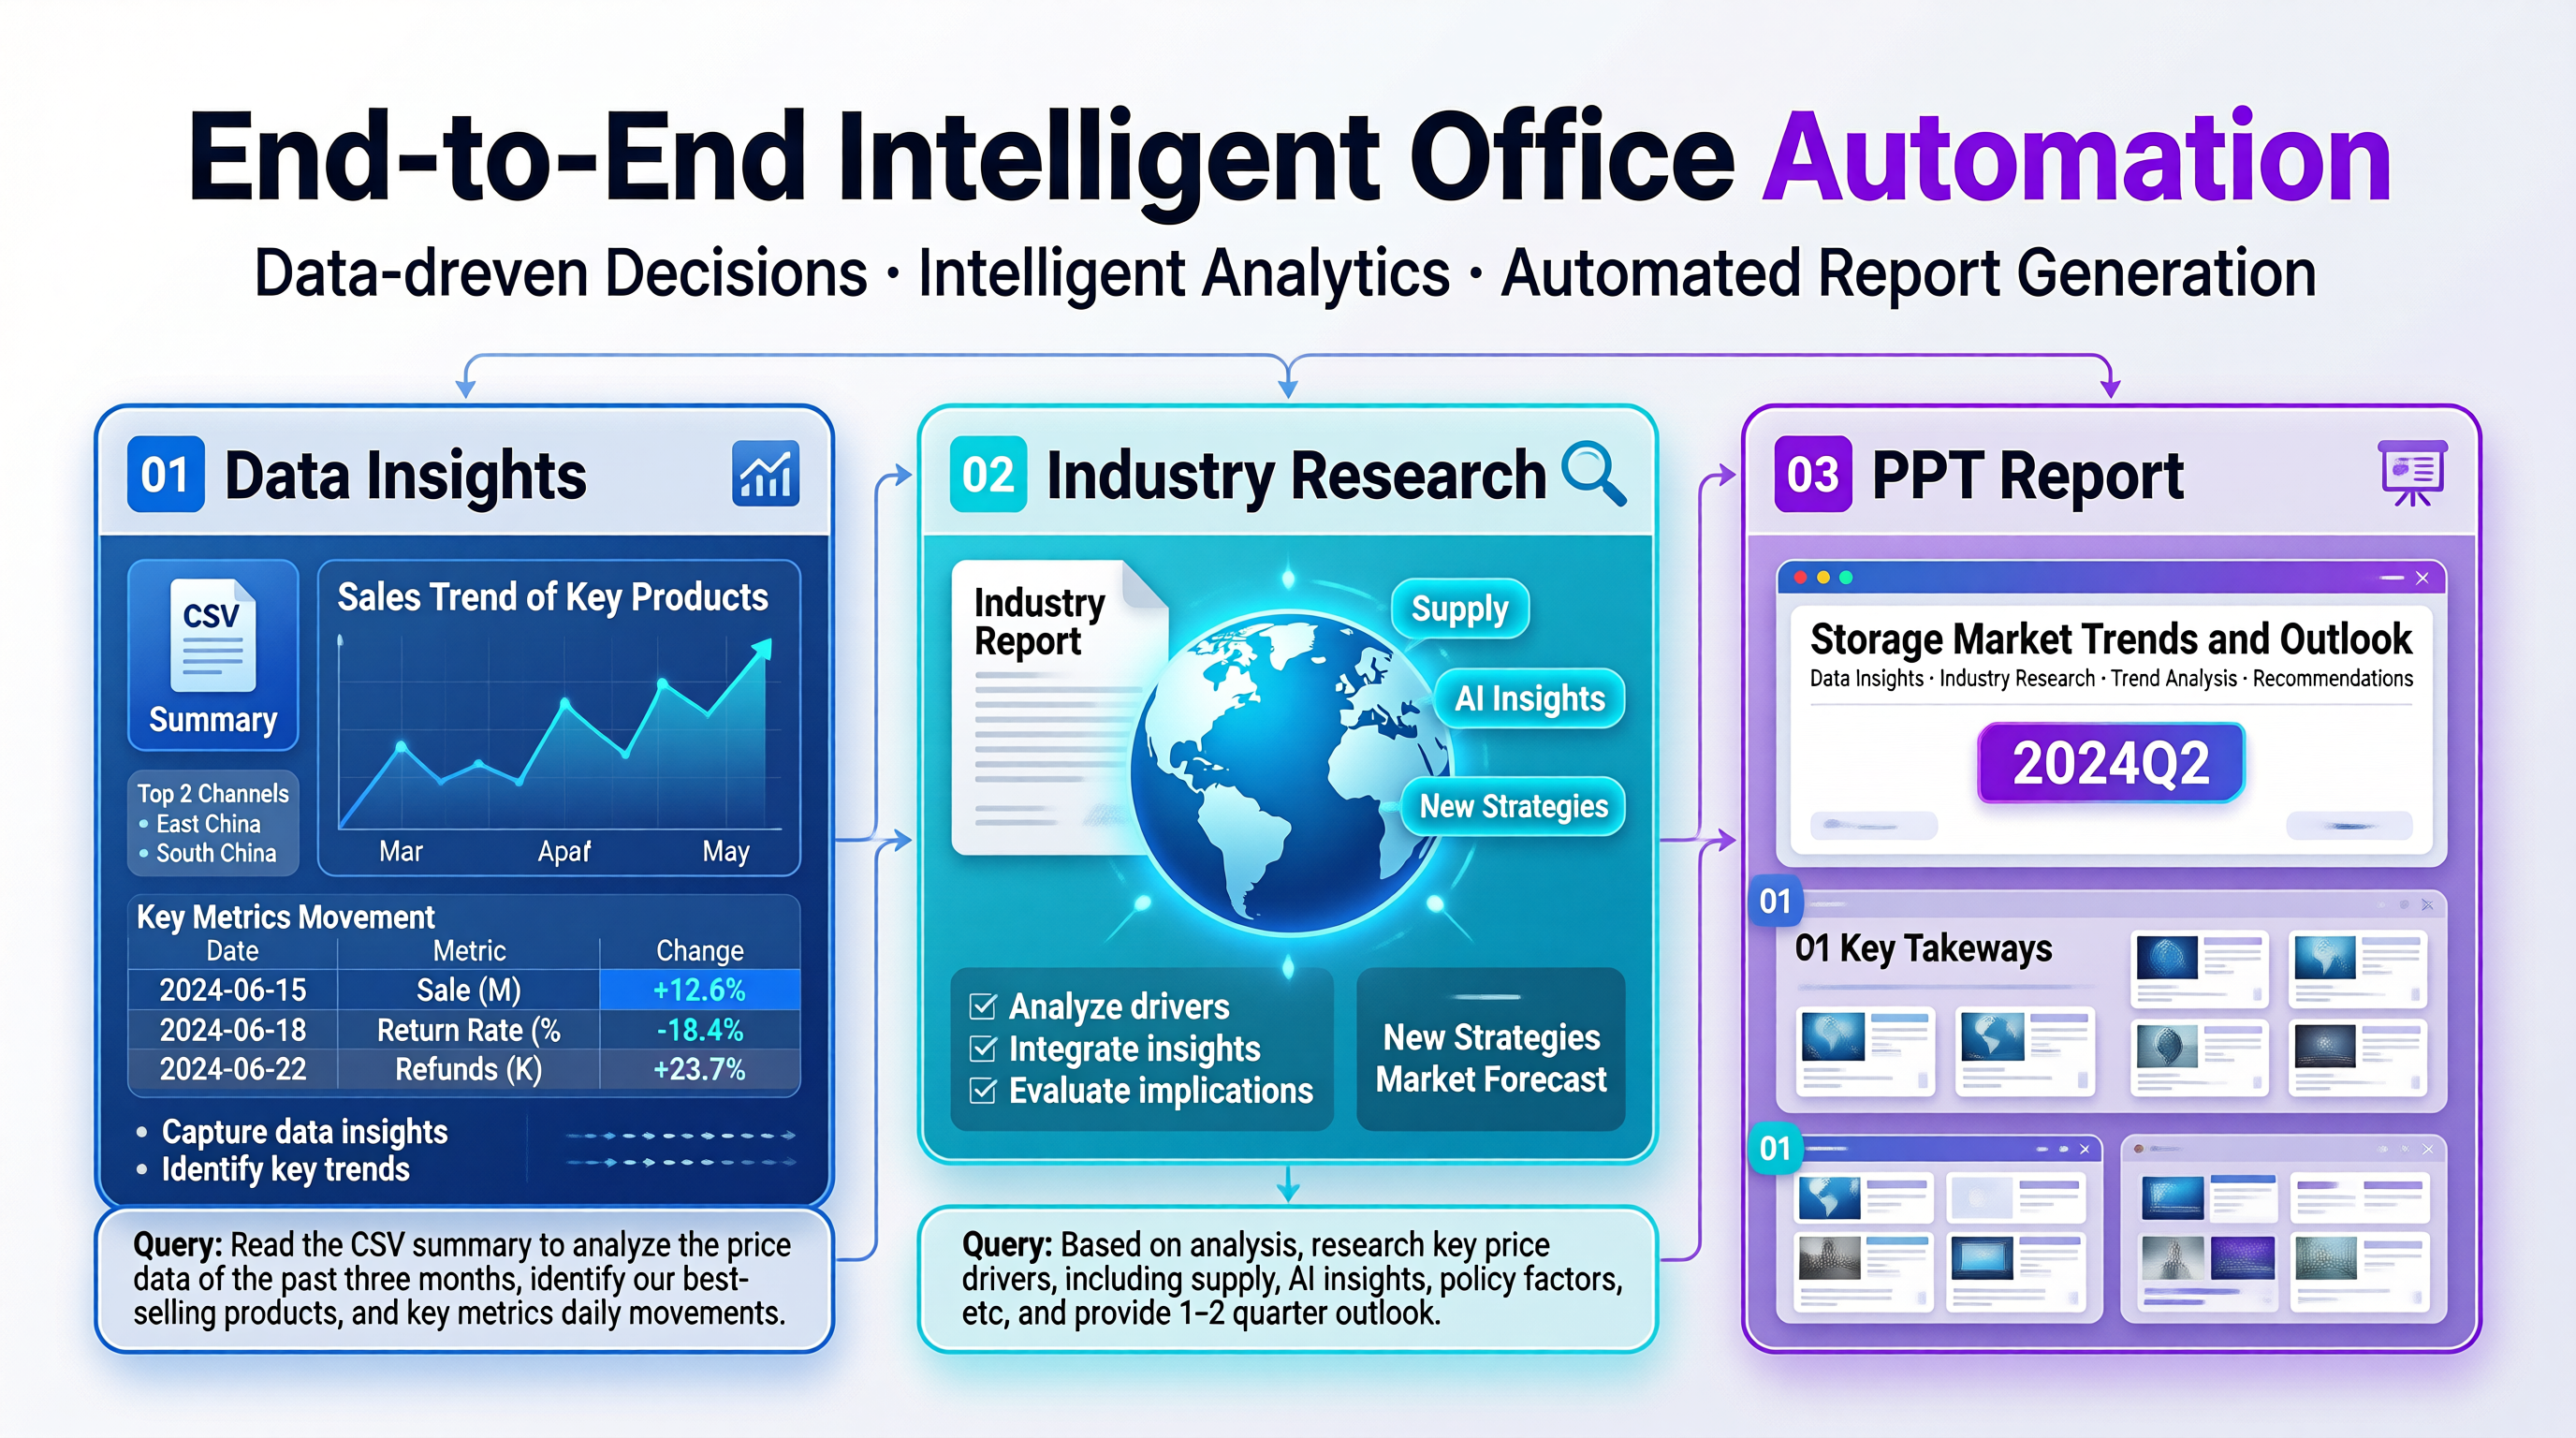
Native multimodal reasoning goes from materials to plans to charts, reports, and decks—input to output in one run.

Part 01

One closed loop for intelligent work

From one raw market sheet to insights, research, and a board-ready deck—data, conclusions, and assets together.

Image generated with SenseNova U1 model

Closed loop: data insights → industry research → PPT
Part 02

Core office scenarios covered

With Cowork-Skills, agents can run the "read → think → act → deliver" loop in real office tasks. Here are three representative cases and outputs.

Data analytics
10 monthly Excel files → one performance report
From 10 monthly Excel files and 932 performance rows, the agent normalizes schemas, analyzes trends, distributions, role comparisons, and individual performance, and recovers from font/plot errors. After user feedback on charts, it traces to the data layer, fixes a MultiIndex issue, and ships the final report—integrate → analyze → generate → trace → verify.
Deliverable
Employee performance report.docx
Word · Report
5 sections8 charts8 tables10 sources
View full case study
Deep research
Investment-grade industry report in one pass
11 chapters on market size, policy, global competition, commercialization, funding, technology, cost, supply chain, roadmap (2026–2028), and recommendations. Covers seven domestic players with global peers; figures in CNY, percentages, YoY; appendix with product specs—investment style, data-first.
Deliverable
2026 China embodied AI industry report
Research · Report
11 chapters9 key companiesSpec appendix
View full case study
Slide decks
8-slide expo-grade deck: “The generative AI revolution”
Eight slides on text/image/video/code generation, automation, business use, and trends—one theme per slide with bold titles, concise copy, 1–2 visuals, and key metrics. Magazine/expo look; images from search; HTML canvas ~1600×900.
Deliverable
Generative AI revolution.pptx
PPT · Showcase
8 slides1600×900Unique layout per slide
View full case study
Part 03

Examples across industries

Skills mix by industry—education, academia, finance, retail, manufacturing, government, and more.

Finance
Industry & company deep dives
Multi-source retrieval, analytics, narrative, and decks—investment-grade loops.
Marketing
Campaigns & competitor intel
Harvest competitor signals, sharpen positioning, ship campaign plans and roadshow decks.
Manufacturing
Ops analytics & management reports
Pull metrics from multi-plant Excel, charts, and board-ready narratives.
Education
Lesson plans & slides
Differentiated lesson plans and decks from syllabus inputs.
Academia
Literature reviews & state of the art
Multi-source search, evidence merge, polished survey drafts.
E-commerce / retail
Weekly & monthly reviews
From databases and sheets to review conclusions and presentable decks.
Government / enterprise services
Policy research & drafting
Retrieve policy text, extract points, structured writing.
Healthcare / pharma
Medical synthesis & summaries
Consolidate literature, anchor conclusions, reporting-ready outputs.
03 / Cowork-Skills

Open skills: last mile from model to scenario

Eight composable skills across understand, act, and generate—use alone or chain for long workflows.

Part 01

Cowork-Skill design

Three layers (understand / act / generate) across eight skills—full multimodal stack.

Layer 01
Multimodal understanding
Parse diverse inputs into structured, reusable assets.
01Material analysis
From docs, pages, notes, and sheets—distill signals and downstream task briefs.
02Multi-source synthesis
Search, filter, merge evidence with traceability for the topic.
03Tables & vision
Understand tables and imagery—fields, definitions, cleaning, preprocessing.
Layer 02
Interactive execution
Refine what you already have—compute and edit in one loop.
04Data insights
Stats, trends, comparisons—auto charts and narrative conclusions.
05Conversational slide polish
Rewrite, restructure, beautify, align style, swap visuals, add slides via chat.
Layer 03
Multimodal generation
Produce high-quality final artifacts from scratch.
06Deck generation
Decks from analysis and briefs—standard or creative paths.
07Report writing
Full reports with abstract, outline, conclusions, comparisons, recommendations.
08Infographics
Turn complexity into posters, summaries, and flow visuals for sharing.
Part 02

Skills across industries

Not one vertical—core knowledge work across education, academia, finance, retail, manufacturing, government, and more.

Legend Strong fit Partial fit
IndustryScenarioMaterial analysisPPT generationPPT refinementMulti-source synthesisReport writingTable & image analysisData insightsInfographics
EducationExam grading & learning analytics
EducationLesson plans & slide decks
AcademiaAcademic writing assistance
AcademiaLiterature reviews & research synthesis
FinanceIndustry & company deep dives
FinanceFinancial statement analysis
E-commerce / retailOps reviews & weekly / monthly reports
MarketingCampaigns & competitor research
ManufacturingOps data analytics & management reporting
Government / enterprise servicesPolicy research & document drafting
Healthcare / pharmaMedical literature & research summaries
General officeReports, summaries & proposals
04 / Token PlanLearn more

More than a discount—a productivity bundle

SenseNova Token Plan is about more than "lower cost"—it’s about "peace of mind." Efficient curated models plus generous caps so long jobs run confidently—high-value, high-frequency, scalable delivery for office productivity.

  • Read, organize, decide
  • Analyze tables, extract conclusions, chart results
  • Ship decks, reports, and infographics
  • Execute across steps—not just advice
01Native multimodal agents
Understand and generate—documents, images, tables to rich deliverables.
02Built for enterprise work
From task understanding to final artifacts—complex flows finish end to end.
03~60% lower token usage
Predictable tokens, more output per dollar, confidence on long chains.